
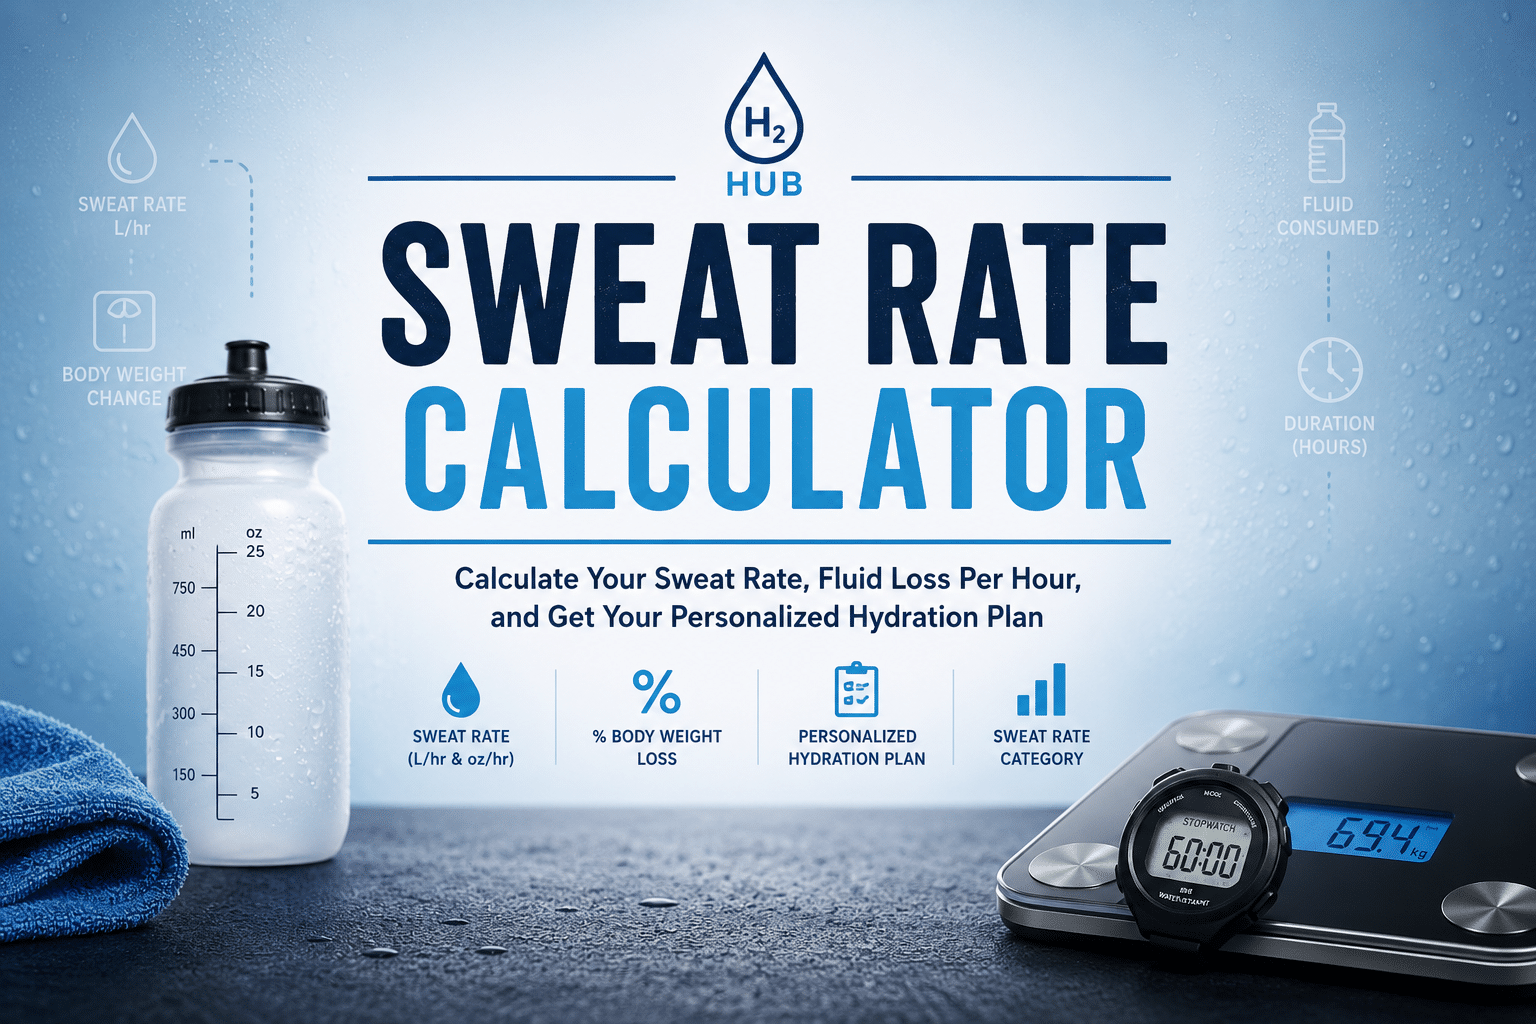
Free Sweat Rate Calculator — Find Your Hourly Fluid Loss in L/hr or oz/hr
Measure your hourly sweat loss, calculate percent body-weight loss, and build a personalized hydration plan for runners, cyclists, triathletes, and team-sport athletes — in under 60 seconds.

⚗️ Sweat Rate Calculator
YOUR SWEAT RATE PROFILE
Your Hydration Plan
Plug in your numbers above to see your personalized fluid replacement strategy.
🩸 Why Your Sweat Rate Matters
Generic advice like “drink eight glasses a day” was never written for someone running a half-marathon in July or pushing a century ride through Arizona. Your sweat rate is the single most useful number for hot-weather training because it tells you exactly how much fluid your body sheds per hour — and how much you have to put back to stay safe and fast. For everyday baseline targets see our daily water intake guide; this page is for what happens once you start sweating.
Lose 2% of your body weight to sweat and your aerobic performance starts to slide. Lose 3–5% and you risk muscle cramps, heat exhaustion, and the kind of cardiovascular drift that ends a race early. Drink too much without sodium and you flirt with exercise-associated hyponatremia (EAH), a low blood sodium emergency that has killed marathoners. A real sweat rate calculator pulls you out of guesswork and into a plan.
📘 What Is Sweat Rate?
Sweat rate (sometimes written as sweating rate or whole-body sweat rate) is the volume of sweat your body produces per hour during exercise. It’s most often expressed in liters per hour (L/hr), milliliters per hour (mL/hr), or fluid ounces per hour (oz/hr).
Your body sweats to cool itself. When you exercise, working muscles produce metabolic heat. Eccrine sweat glands across your skin release fluid that evaporates and pulls heat from the surface — the core mechanism of thermoregulatory sweating. The harder you work and the hotter your environment, the more your body needs to dump heat, and the higher your sweat rate climbs.
Who Should Calculate It?
🏃 Endurance Athletes
Distance runners, marathoners, ultra-endurance racers, road cyclists, mountain bikers, and triathletes preparing for an IRONMAN or IRONMAN 70.3.
⚽ Team-Sport Athletes
Soccer, American football (NFL or college), basketball, lacrosse, tennis, and baseball players training in heat or playing in full kit.
🏋️ Gym & CrossFit
CrossFit, strength training, hot yoga, HIIT — anyone who finishes a session soaked and wondering whether that’s normal.
🛡️ Hot-Climate Workers
Military, tactical athletes, firefighters, construction crews, and outdoor laborers facing exertional heat stress on the job.
👨👩👧 Coaches & Parents
Youth sport coaches, athletic trainers, and parents trying to keep young athletes safe in summer practice and tournaments.
🥼 Sports Dietitians
RDs, CSSDs, and sports scientists who need a credible, citable tool to share with clients building a fluid replacement strategy.
[Visual aid: hero illustration — split image of an athlete weighing in pre-run vs. post-run with a digital scale, highlighting the change in body mass.]
🧮 The Sweat Rate Formula
The sweat rate formula is simple algebra: how much weight you lost (in fluid mass), plus what you drank, minus what you peed out, divided by how long you exercised.
Quick conversion: 1 lb of body-weight loss ≈ 16 fl oz of sweat ≈ 0.45 kg ≈ 450 mL. One gram of sweat equals one milliliter — handy for fast metric math. For more volume conversions, see our ounces-to-gallons guide.
Worked Example
A 154 lb (70 kg) recreational runner heads out for a 60-minute training run on a warm afternoon. She drinks 16 oz from her water bottle, doesn’t stop to pee, and weighs in at 152 lb afterward.
- Weight lost: 2 lb × 16 = 32 oz of sweat
- Plus fluid consumed: + 16 oz
- Total fluid lost: 48 oz
- Duration: 1 hour
- Sweat rate: 48 oz/hr (≈ 1.4 L/hr)
That’s a moderate-to-high sweat rate — exactly where most fit female runners land in warm conditions, according to data from Baker et al. (2019).
Why the Formula Can Mislead You
- Short sessions under 30 minutes skew low because your body doesn’t fully ramp up its sudomotor response.
- Long sessions over 2 hours blend in glycogen utilization and respiratory water loss, which look like sweat on a scale but aren’t.
- Skipped fluid logging is the most common mistake — every sip counts.
- Different clothes pre vs. post can add a quarter-pound of error from sweat-soaked fabric.
🧪 How to Perform a Sweat Rate Test at Home
You don’t need a sports science lab. You need a digital scale, a measured water bottle, and a stopwatch.
What You’ll Need
⚖️ Digital scale
Accurate to at least 0.1 lb (0.1 kg). Bathroom body weight scales work fine if you trust the calibration.
💧 Pre-measured bottle
Know the exact starting volume so you can subtract what’s left at the finish. A good insulated water bottle keeps temperature stable during long tests.
⏱️ Stopwatch
Sports watch, phone, or Garmin — anything that gives you minutes accurate to the second.
🧻 Towel
For the post-workout dry-off. Pool water, rain, and surface sweat will throw the numbers off.
The 8-Step Protocol
- Hydrate normally over the prior 24 hours. Drink to thirst. Don’t over-hydrate or restrict.
- Empty your bladder immediately before weighing in.
- Weigh in nude (or in dry, minimal clothing — note what you wore, you’ll wear the same thing post-workout).
- Pre-measure your drink volume so you can calculate fluid intake to the ounce.
- Exercise at race or training intensity for 60 minutes. Minimum 30 minutes, maximum 2 hours.
- Don’t urinate during the test if you can avoid it. If you must, estimate ~300 mL (10 oz) and subtract.
- Towel off thoroughly and re-weigh in the same clothing state.
- Plug your numbers into the calculator above. Repeat in different conditions to build a profile.
[Visual aid: 8-step protocol illustration — clean iconographic timeline showing scale → bottle → run → towel → scale → calculator.]
Common Mistakes That Skew Your Results
⚠️ Peeing mid-test without logging
Even one bathroom break shifts the math. Estimate or test on a day you can hold it.
⚠️ Different clothes pre vs. post
Sweat-soaked shorts can hide a quarter-pound of fluid. Weigh nude or in the exact same dry kit.
⚠️ Testing for too short
Under 30 minutes your sweat response hasn’t peaked. The number reads low.
⚠️ Forgetting fluid intake
Every sip from the bottle counts. Skipping this turns a 1.4 L/hr sweater into a “1.0 L/hr” sweater on paper.
⚠️ One-and-done testing
Sweat rate varies 8–12% day to day even in matched conditions. Test 3 to 5 times before trusting the average.
⚠️ Eating during the test
A 200-calorie gel weighs in too. For accuracy, fast — or weigh the gel and add it as “fluid in.”
🎯 How to Interpret Your Sweat Rate
Your number alone is meaningless without context. Here’s where you land relative to the population, and what that means for your hydration plan.
< 16 oz/hr
You’re a light sweater. Common in cooler climates, low-intensity sessions, smaller athletes, and women. Drinking to thirst is usually enough for sessions under 90 minutes.
16 – 48 oz/hr
The typical sweat rate for most exercisers. Aim to replace 60–80% with fluid that includes sodium for sessions over 60 minutes.
48 – 80 oz/hr
You’re a heavy sweater. A deliberate, scheduled drinking plan with electrolytes is non-negotiable for anything over an hour.
> 80 oz/hr
Rare. Common in NFL linemen, large endurance athletes in heat, and acclimatized pros. Requires aggressive pre-hydration, sodium preloading, and on-course refueling.
[Visual aid: color-coded sweat zone infographic — Low/Moderate/High/Very High with L/hr and oz/hr ranges, plus a “you are here” marker linked to the calculator result.]
Average Sweat Rate by Sport
Whole-body sweating rate (WBSR) data drawn from Baker et al. (2019), the most cited normative dataset in the field.
| Sport / Population | Mean Sweat Rate | oz/hr Equivalent | Notes |
|---|---|---|---|
| Endurance athletes (general) | 1.28 L/hr | 43 oz/hr | ± 0.57 L/hr SD |
| American football (NFL pre-season) | 1.51 L/hr | 51 oz/hr | Linemen frequently > 2.5 L/hr |
| Basketball | 0.95 L/hr | 32 oz/hr | Indoor, cooler |
| Soccer | 0.94 L/hr | 32 oz/hr | Wide range based on climate |
| Baseball | 0.83 L/hr | 28 oz/hr | Lower intensity |
| Tennis (singles, hot) | 1.0–1.6 L/hr | 34–54 oz/hr | Climate dependent |
| Recreational male runners (tropical) | 1.3 L/hr | 44 oz/hr | Lee et al. |
| Recreational female runners (tropical) | 0.9 L/hr | 30 oz/hr | Lee et al. |
| Pool swimming | 0.5–1.0 L/hr | 17–34 oz/hr | Yes, swimmers sweat |
| Meta-analysis (461 athletes) | ~1.25 L/hr | 42 oz/hr | Range 0.5–3.5 L/hr (Baker, 2017) |
[Visual aid: horizontal bar chart of average sweat rate by sport — sorted descending, with cited L/hr values and source labels.]
Are You a “Salty Sweater”?
Sweat sodium concentration varies more between people than sweat volume does. Typical values land between 20 and 80 mmol/L (roughly 460–1,840 mg of sodium per liter of sweat). Watch for these telltale signs:
- White crusts on your cap, jersey, or skin after long sessions
- Stinging eyes from sweat dripping in (high sodium burns more)
- A salty taste on your lips during exercise
- Recurrent exercise-associated muscle cramps that respond to salt
If three or more apply, you’re likely a salty sweater. A consumer sweat patch from Gx (Gatorade), a wearable like Nix Biosensors or hDrop, or a lab test from a sports physiologist can quantify it.
📋 Turn Your Sweat Rate Into a Hydration Plan
Sweat rate is just a number until you turn it into action. Here’s how to build a fluid replacement strategy you can actually execute on race day.
The 75% Rule
The American College of Sports Medicine (ACSM) and the National Athletic Trainers’ Association (NATA) both agree: you don’t need to replace 100% of fluid losses during exercise. Aim for 60–80% replacement. Trying to match losses ounce-for-ounce risks gastric distress at best and exercise-associated hyponatremia at worst.
Drinking to Thirst vs. Scheduled Drinking
Ad libitum drinking — sipping when thirsty — works well for most athletes in events under 2 to 3 hours, especially with a moderate sweat rate. A scheduled hydration plan wins when your sweat rate exceeds 1.5 L/hr, the heat is brutal, or the event runs longer than the half-marathon distance.
Three Worked Hydration Plans
Light Sweater · Half-Marathon
- Pre-hydration: 16 oz / 500 mL two hours before, with a pinch of salt.
- During: 12–15 oz (350–450 mL) per hour of electrolyte drink — sip every aid station.
- Post: 16 oz per pound lost, plus a salty snack within 30 minutes.
- Sodium target: 300 mg/L of fluid.
Moderate-High · 3-Hour Bike Ride
- Pre-hydration: 20 oz / 600 mL two hours out, with sodium preloading.
- During: 24–32 oz (700–950 mL) per hour split between two bottles — one water, one electrolyte mix.
- Post: 20–24 oz per pound lost, plus a recovery shake.
- Sodium target: 500–700 mg/L of fluid.
Heavy Sweater · Hot Marathon
- Pre-hydration: 24 oz / 700 mL with sodium preload 90 minutes out.
- During: 28–32 oz (830–950 mL) per hour — never above 32 oz. Pair with salt capsules or chews.
- Post: 24 oz fluid per pound lost over 2–4 hours; include a recovery meal with sodium.
- Sodium target: 700–1,000 mg/hr total.
[Visual aid: 3-card hydration plan visualization with pre/during/post timelines, color-coded to sweat zone.]
Post-Workout Rehydration: The 24 oz Per Pound Rule
For full recovery hydration, drink 20–24 oz (600–700 mL) of fluid for every pound of body weight lost. Pair it with a salty snack or recovery drink — plain water alone dilutes blood sodium and slows rehydration.
🧂 Sodium & Electrolytes: The Other Half of Hydration
Sweat is more than water. Every drop carries sodium chloride, potassium, magnesium, calcium, and trace minerals out of your body. Replace fluid without replacing electrolytes and you tilt your electrolyte balance the wrong way.
How Much Sodium Are You Losing?
Sweat sodium concentration ranges from 10 to 90 mmol/L. A heavy sweater with 60 mmol/L sweat sodium loses roughly 1,380 mg of sodium per liter. Multiply that by your sweat rate for an hourly figure.
Example: 1.5 L/hr × 1,200 mg/L = 1,800 mg of sodium per hour
Sports Drinks vs. Tablets vs. Powders
🥤 Sports Drinks
Pre-mixed bottles from brands like Gatorade, Skratch Labs, Nuun, or Precision Fuel & Hydration deliver carbohydrates plus electrolytes in one bottle. Best when you also need fuel.
💊 Electrolyte Tablets
Effervescent tablets or salt capsules let you dial sodium independently from calories. Useful for low-carb athletes, salty sweaters, and long ultra events.
🧂 Electrolyte Powders
Powders such as LMNT, Liquid IV, and Skratch Labs Hydration Mix let you control concentration. Add to your favorite water bottle for custom strength.
💧 Plain Water
Fine for sessions under 60 minutes and low sweat rates. Risky for long, hot, high-sweat sessions because of hyponatremia.
🌡️ Factors That Affect Your Sweat Rate
Your sweat rate today is not your sweat rate next week. Twelve variables move the number. Knowing which ones shifted helps you re-tune your plan.
🔥 Exercise intensity
The biggest single lever. Workout intensity correlates almost directly with sweat output — heart rate up, sweat up.
🌞 Ambient temperature
Every degree of WBGT (wet-bulb globe temperature) rise drives more thermoregulatory sweating to dump core heat.
💨 Relative humidity
High humidity blocks evaporative cooling. Your body responds by producing even more sweat to compensate. Hot and humid is the worst combination.
🌬️ Wind & airflow
A breeze cuts sweat output up to 20% by speeding up evaporation. Treadmill sessions feel hotter for a reason.
🏝️ Heat acclimatization
Heat-acclimated athletes start sweating earlier and produce more total sweat, but at a lower sodium concentration — the body adapts to conserve salt.
👤 Body size & composition
Larger athletes have higher absolute sweat rates because they generate more metabolic heat. Body mass and muscle mass both push the number up.
♂️♀️ Sex differences
Men typically sweat more in absolute terms than women, mostly due to body-size differences and a higher metabolic heat production at the same workload.
🕰️ Age
Sweat-gland function and density decline gradually after 60. Older athletes may sweat less and overheat faster.
👕 Clothing & gear
Football pads, motorcycle leathers, firefighter turnout gear — anything that blocks evaporation forces sweat rate up.
💪 Fitness level
Fitter, aerobically trained athletes have a more efficient sudomotor response. They sweat earlier and dissipate heat better.
🧬 Genetics
Sweat gland density is partly inherited. Some people are just heavier sweaters out of the gate.
💧 Hydration status
Going in dehydrated (hypohydration) shifts the balance. Pre-hydration and euhydration matter — they’re not “extra credit.”
🛡️ Dehydration vs. Hyponatremia: Why You Need This Number
Dehydration
Losing more fluid than you replace.
- 2% body weight loss: Performance decline begins
- 3–5%: Heat cramps, heat exhaustion risk
- >5%: Heat stroke risk; medical emergency
- >7%: IV intervention likely needed
Signs: Dark urine, headaches, dizziness, fatigue, nausea, chills despite heat, bonking.
Quick check: Pale lemonade urine = euhydrated. Dark apple juice = dehydrated.
Hyponatremia (EAH)
Drinking more than you sweat, especially plain water.
- Blood sodium drops below 135 mmol/L
- Severe cases can be fatal — marathoners have died from it
- Most common in slower runners over 4-hour races
- Risk climbs with low-sodium fluids
Signs: Nausea, headache, bloating, confusion, swelling of hands/feet, seizures in severe cases.
Quick check: Are you gaining weight during a long event? Stop drinking. Add sodium.
[Visual aid: side-by-side symptom comparison graphic — dehydration vs. hyponatremia with shared and distinct warning signs.]
🔬 Beyond the Calculator: Tools for Serious Athletes
The at-home sweat test answers how much you sweat. It doesn’t answer how salty. If you’ve ruled in salty sweater status, these tools sharpen the picture.
🧪 Lab Sweat Test
An in-person test (Precision Fuel & Hydration, GSSI, performance labs) measures sweat sodium concentration directly using a forearm patch and pilocarpine iontophoresis. The gold standard for the serious endurance athlete.
📟 Wearable Patches
Single-use patches like Gatorade Gx, Nix Biosensors, and hDrop pair with a phone to read real-time sweat rate and sodium during a workout. Useful for repeat testing across conditions.
📊 Tracking Spreadsheets
Log every test session — date, temperature, humidity, intensity, sweat rate, sodium estimate. A profile beats a single number every time.
🥄 Hyperhydration Aids
For ultra-endurance, advanced strategies like sodium preloading, glycerol, betaine, and creatine monohydrate can expand plasma volume before extreme heat events. Discuss with a sports dietitian first.
When to See a Sports Dietitian
Book a Registered Dietitian (RD) or board-certified sports dietitian (CSSD) if you’re racing IRONMAN distance, an ultramarathon, in a hot climate, or struggling with recurrent muscle cramps despite a solid plan. The International Society of Sports Nutrition (ISSN), TrueSport, USA Cycling, and your national governing body all maintain practitioner directories.
❓ Frequently Asked Questions
A sweat rate calculator converts your pre- and post-exercise body weight, fluid intake, and workout duration into an estimate of how much fluid you lose per hour. The output is usually shown in liters per hour (L/hr) or fluid ounces per hour (oz/hr).
For most adults during moderate exercise, 0.5–1.5 L/hr (16–48 oz/hr) is normal. Endurance athletes average around 1.25 L/hr; American football players average about 1.5 L/hr (Baker et al., 2019). Anything from 0.8 to 1.4 L/hr is typical for a fit recreational athlete.
Above 1.5 L/hr (48 oz/hr) is on the high end. Above 2.5 L/hr (80 oz/hr) is very high and demands a deliberate, scheduled hydration plan with electrolytes. The highest recorded sweat rate during exercise is about 3.71 L/hr (Alberto Salazar).
ACSM guidance is to replace 60–80% of fluid losses during exercise, not 100%. Never drink more per hour than you sweat per hour. For sessions over 60 minutes, include sodium (300–700 mg per liter of fluid). For non-exercise baseline targets see our daily water intake guide.
Yes. Even in matched conditions, day-to-day variability sits around 8–12%. Heat, humidity, intensity, clothing, fitness level, and heat acclimatization status can swing it much more than that.
On average, yes — but it’s mostly a function of body size and absolute metabolic heat production at the same workload. Pound for pound, sweat rate differences between sexes are small.
Humid heat produces a higher total sweat output. Sweat doesn’t evaporate well in high humidity, so your body keeps producing more to try to cool itself — without much cooling payoff.
Reasonably accurate (±10–15%) when done carefully across 3+ sessions in matched conditions. Use the number directionally — as a guide for planning — not as a precise medical prescription.
Sweat rate is the volume of fluid you lose per hour. Sweat sodium concentration (typically 20–80 mmol/L) is how salty that sweat is. Multiply the two for your hourly sodium loss.
Most “heavy sweaters” are simply efficient thermoregulators. Hyperhidrosis is a clinical condition involving excessive sweating at rest or with minor stimuli, and it’s distinct from a high exercise sweat rate. Talk to your physician if non-exercise sweating affects daily life.
Both work. Ad libitum drinking (to thirst) is safe and effective for most events under 3–4 hours with a moderate sweat rate. A scheduled plan wins for sweat rates above 1.5 L/hr, hot conditions, and ultra-distance events.
Re-test when conditions change significantly: a new season, a hotter race climate, after heat acclimatization, or when you change sport or intensity. A profile of 3–5 tests across conditions beats a single number every time.
That’s a red flag for overdrinking and exercise-associated hyponatremia. Stop or slow fluid intake immediately and add sodium. If you feel nauseous, confused, or swollen, seek medical help.
Yes. Pool swimmers do sweat — typically 0.5–1.0 L/hr. Towel off thoroughly before the post-workout weigh-in so pool water doesn’t skew the number.
Close, but not identical. Body weight can also change from glycogen utilization, fuel oxidation, and respiratory water loss. Those effects are small under 2 hours and significant beyond it.
📚 Sources, Author & Editorial Standards
About the Author
This sweat rate calculator and guide was built by the WaterBottleInfo.com hydration team, led by Mahmudul. The content was reviewed against peer-reviewed research and position statements from the American College of Sports Medicine (ACSM), the National Athletic Trainers’ Association (NATA), and the International Society of Sports Nutrition (ISSN). Last updated May 20, 2026.
Disclaimer
This page is for educational purposes and is not medical advice. Hydration needs vary by individual, medication, and medical history. Consult a sports dietitian or physician before making major changes to fluid intake — especially if you have a history of cardiovascular disease, kidney disease, or a documented disordered-eating relationship with the scale.
Cited Research & Authoritative Sources
- Baker, L.B. (2017). Sweating Rate and Sweat Sodium Concentration in Athletes: A Review of Methodology and Intra/Interindividual Variability. Sports Medicine.
- Baker, L.B. et al. (2019). Normative data for sweating rate, sweat sodium concentration, and sweat sodium loss in athletes. Journal of Sports Sciences.
- American College of Sports Medicine (ACSM). Position Stand on Exercise and Fluid Replacement.
- National Athletic Trainers’ Association (NATA). Position Statement: Fluid Replacement for the Physically Active.
- Korey Stringer Institute, University of Connecticut — Sweat Rate Calculation Protocol.
- Centers for Disease Control and Prevention (CDC). Sweat Rate Calculation Formula.
- Gatorade Sports Science Institute — Fluid Loss research library.
- Precision Fuel & Hydration — How to Measure Your Sweat Rate (Andy Blow).
- Maughan, R.J. & Shirreffs, S.M. Dehydration and rehydration in competitive sport.
- TrueSport / USA Cycling — Why and How to Calculate Your Athlete’s Sweat Rate (Kristen Ziesmer, RD, CSSD).
- UCLA Health — Why Athletes Need to Know How Much They Sweat.
- Asker Jeukendrup, mysportscience — How Much Do You Sweat?
Continue Exploring